Product Update – Services Page Redesign
As our industry has grown, so have we. When we started there were a few handfuls of Services and now that number has more than tripled. We refreshed our Services page to create a better experience before, during, and after you set up your Services.


Here are a few of the details of the experience we’ve worked to improve.
Understanding Service Capabilities
The amount of Services and capabilities grows every week. We know it’s hard to keep up with new Services as well as an existing Service’s expanding capabilities. We surfaced information to help you understand a Service’s capabilities before you activate.
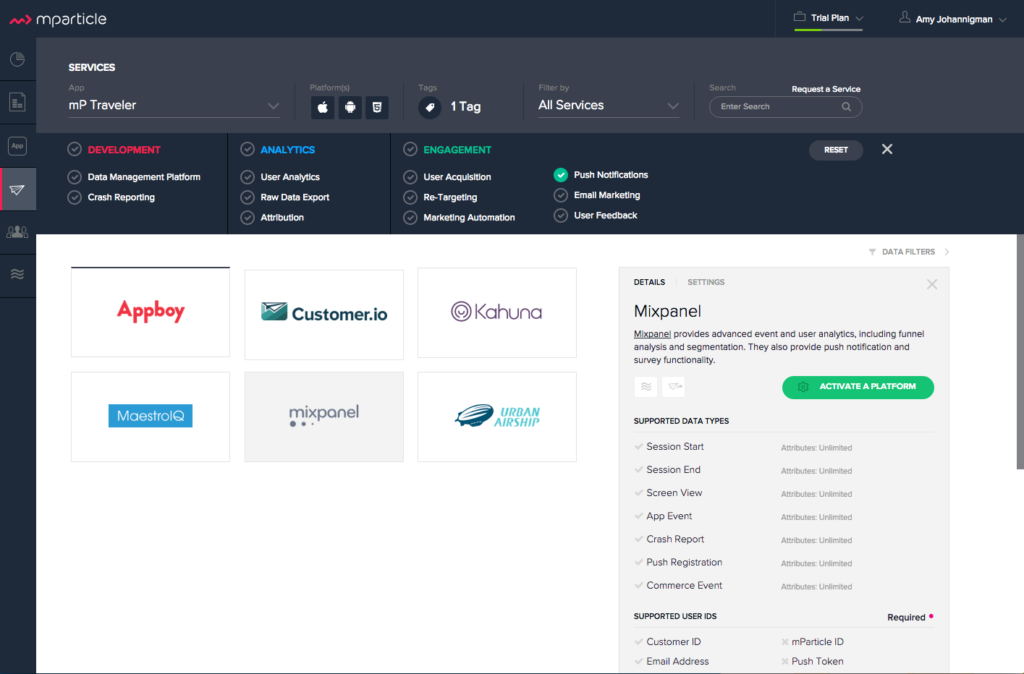
- Details Panel: The new Details Panel displays summary information about each Service on the same screen. We list Supported Data Types, Supported User IDs, Supported Device IDs, and Tags.
- Tags: We have added tags to each Service to help identify core common capabilities across Services. You can filter by Tags or view all of a Service’s Tags on the bottom of the Details Panel. To Filter by Tags; click the Tag icon in the top blue filter bar to open the Tag Filter Drawer. You can filter individual Tags or a category of Tags by clicking on the color category label- i.e. Analytics.
Monitoring Your Services
Monitoring and managing Services you’ve set up should only take a few clicks from the same page. We reworked the interactions of the Services page to create new views and click throughs for your Active Services.
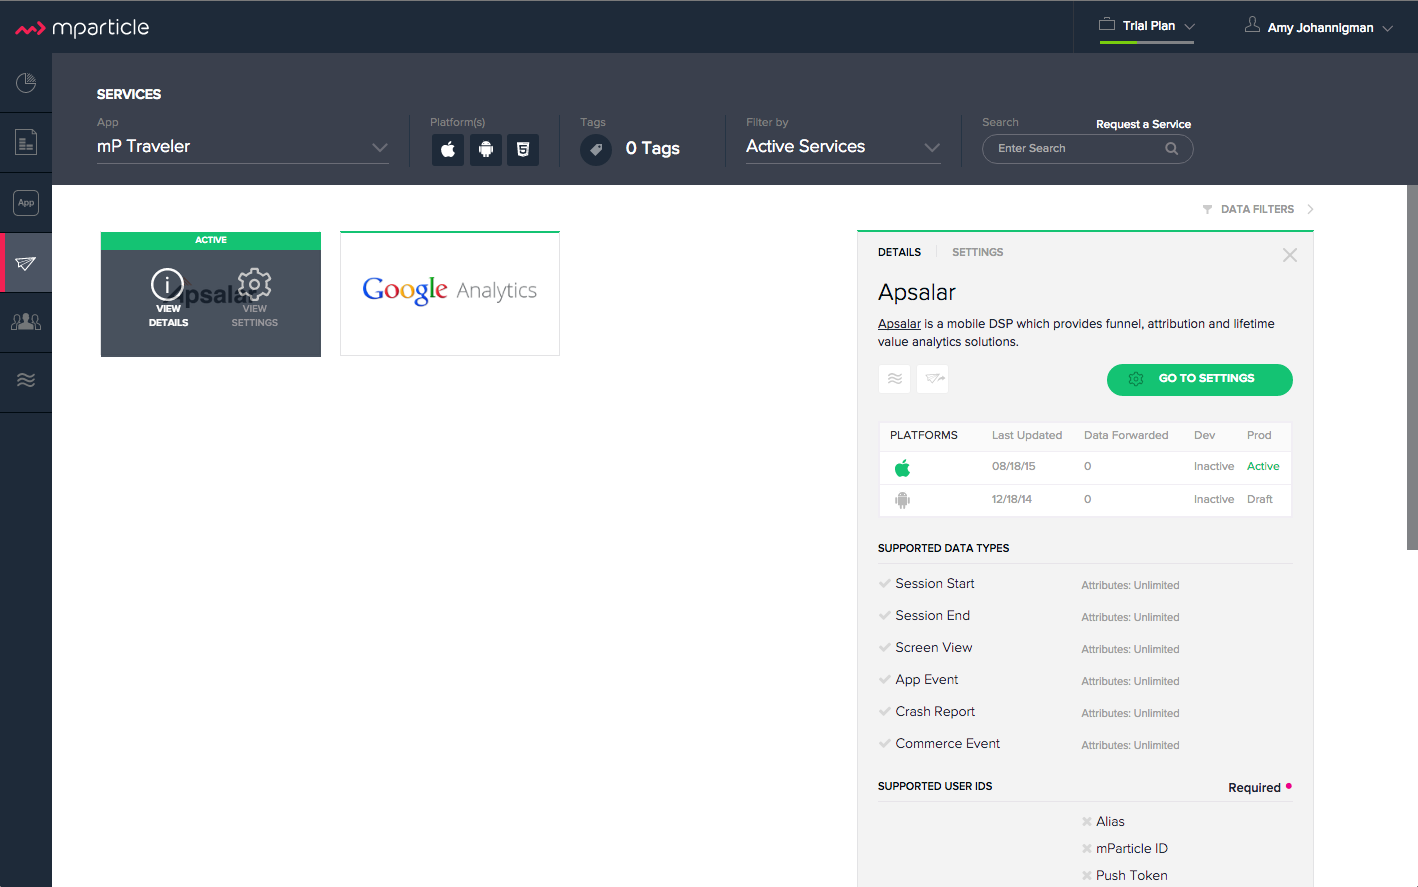
- Active Services Filter: We’ve created a filter to view only your “Active Services” (in the top blue filter bar, use the drop down that says “Filter By” and you can choose “Active Services”.) You can also tell if a Service is active by the green status line at the top of the Service tile.
- Active Service’s Settings & Status: The Service tiles have a few shortcuts built into them. One click on the right of an active Service tile will open the Settings Panel. Clicking on the left of an active Service tile opens the Details side of the panel and provides an overview of status for all active platforms. The overview indicates which platforms are activated, when they were last updated, data forwarded, and the status of the Dev and Prod data types.
Linking to Data Tools
After setting up or updating a Service you may want to view the data. We’ve added some additional links to streamline that process.
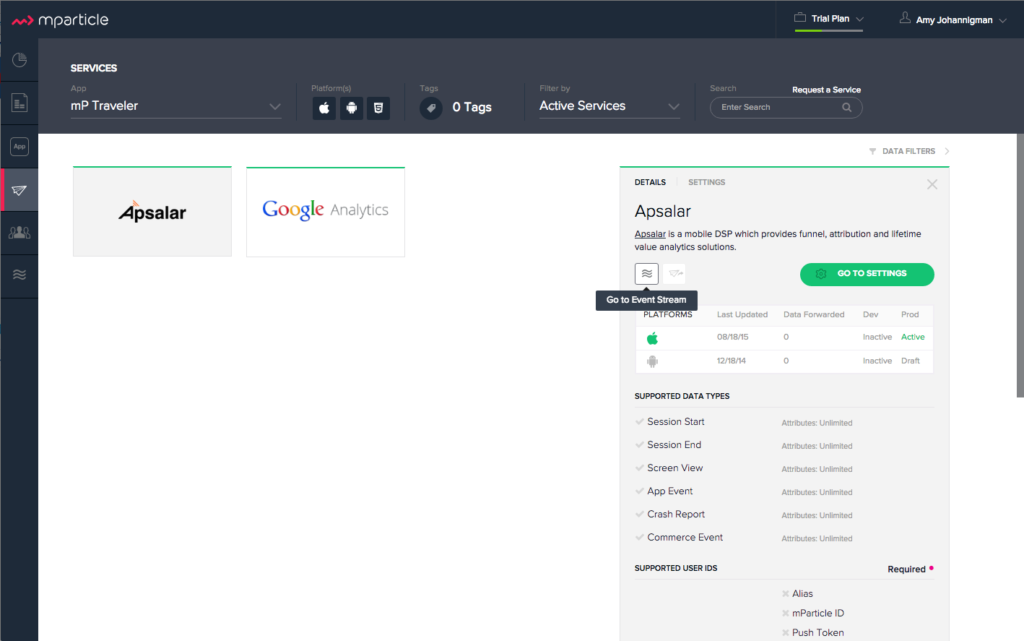
- Data Links: This update is small but still nice, we’ve added a link to take you directly into the Event Stream to view live data. We’ve also added a link to open the Data Report to see what data has already been sent.
We know that the Service page is key to using the mParticle platform and we wanted to make that experience even better. We hope you find these updates helpful, and we have many more coming your way. We also love feedback and suggestions, so contact us anytime to share your thoughts!


